We remain fully operational. Our teams are working around the clock to ensure your deliveries continue safely.

قم بتنزيل التطبيق


معلومات عنا
حقوق الطبع والنشر © 2024 Desertcart Holdings Limited
قم بتنزيل التطبيق

🌬️ Breathe smarter, live better — your air’s new best friend!
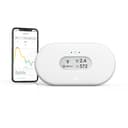
The Airthings 2960 View Plus is a premium, battery-powered indoor air quality monitor that continuously measures radon, PM2.5, CO2, VOCs, humidity, temperature, and air pressure. With WiFi connectivity and a user-friendly app, it delivers real-time data and alerts to help you maintain a healthier living or working environment. Trusted by over a million users and backed by 15 years of expertise, it features a sleek eInk display, cloud data storage, and an optional 5-year warranty for peace of mind.


| ASIN | B097YW5Q72 |
| Alarm | Visual |
| Best Sellers Rank | #2,201 in Industrial & Scientific ( See Top 100 in Industrial & Scientific ) #3 in Indoor Air Quality Meters |
| Brand | Airthings |
| Built-In Media | Air Quality Monitor, 6 AA batteries, USB C cable |
| Color | white |
| Compatible Devices | Airthings View series, Airthings Hub, Alexa, Homey |
| Customer Reviews | 4.1 4.1 out of 5 stars (1,840) |
| Enclosure Material | 1 |
| Item Dimensions D x W x H | 4"D x 4"W x 2"H |
| Item Type Name | Corentium Home Radon Detector |
| Item Weight | 0.36 Pounds |
| Manufacturer | Airthings |
| Manufacturer Warranty Description | Airthings has a 5-year extended warranty available on all air quality monitors for consumers. Registration is required within 30 days of the purchase on the Airthings website. Registration is free and your statutory rights are not affected. |
| Model Number | 2960 |
| Operating Humidity | <85% |
| Power Source | Battery Powered |
| Product Style | View Plus |
| Sensor Type | radon detector |
| UPC | 854232008224 |
| Unit Count | 1.0 Count |
| Upper Temperature Rating | 104 Degrees Fahrenheit |
C**A
Great product, great customer support
Update: We bought our Airthings View Plus on July 10, 2025, and used it as the hub for a Wave Plus and a Wave Enhanced. Great product—totally satisfied at first. In mid-September, the View Plus started reporting high CO₂ levels. The readings fluctuated but stayed in the Poor range and never dropped back to Fair or Good. I checked the Airthings website, which recommends placing the device near an open window and circulating fresh air to improve indoor air quality. I tried that, but the readings didn’t improve. To compare, I placed my Wave Plus next to it. The Wave Plus showed normal readings, but the View Plus remained unchanged. Something was clearly wrong, so I took pictures and contacted Don at Airthings. Don suggested a few troubleshooting steps and said if those didn’t work, we could try other options. I followed his suggestions—still no change. I sent more pictures, and Don asked for the device’s serial number and a copy of the purchase invoice. I sent the information, and within two days, he told me they were sending a replacement View Plus. They didn’t even want the defective unit back. The new device arrived within a week. I had a question about removing the old device, pairing the new one, and the impact on the App and website Dashboard. Don responded promptly. Replacement was easy-peasy. Airthings has fantastic product support—responsive and easy to work with. I highly recommend their products for monitoring air quality. They stand by their products and provide excellent customer service. Yes, they’re pricey and come from Europe, but they’re worth every penny. Great product. Great support. Highly recommended. Bought on sale along with Wave Enhanced for 2nd room. CO2 was the concern. Very happy with product and sale price. Customer service very helpful when asked about 5-year warranty registration and query concerning owners manuals. Manuals and comprehensive information are located on-line only, no .pdf's. When setting up hub be aware: Unit displays message HUB MODE ON, instructions do not say so, but this message only displays for 5-10 seconds. Consequently you might miss it and start over as I did, several times. Once done WAVE Enhanced connected. There is not much information on the HUB Mode in the product info description. Essentially it makes the unit and all units connected to it continuously available on-line via Airthings Dashboard. Airthings Dashboard, on-line only, very useful. Bookmark it on your phone for easy access. I like the product and would buy again. Customer service excellent and responsive. Struggled with initial Hub set-up.
A**R
Multiple sensors with good user interface
Tl:dr I recommend this product. I believe that it is currently the best on the market and provides a good array of sensors for the price. I have not received any financial or other consideration for this review. I have no connection to the company. Details, positive and negative, are found in the review. Intro: In operation (after 7-day calibration) for three weeks beginning October 2021. Unit is located indoors in the bedroom of a small single-story home in northern California. I purchased View Plus after an online evaluation of competitive units. The purchase decision was based on the array of sensors, acceptable display of sensor parameters, appearance of a good user interface, ability to easily download the data in Excel .csv file format, designed in Norway, and assembled in Tunisia (visible in product photos). I expect that this is the first product that I’ve ever owned that was assembled in Tunisia. There were no Amazon reviews as I purchased the unit as soon as it became available. My primary motivation for purchase was to measure indoor particulate pollution during the wildfires. I wanted a more quantitative measure than the colored indicators on our air purifiers. However, I have since become more interested in the carbon dioxide (CO2) and VOC levels. The inclusion of Radon, temperature, humidity, and atmospheric pressure sensors is a plus. Particulates: I have had an extended conversation with Airthings via the app. They are responsive, although it may take a few days or even a week, if you ask technical questions as these need to go to the engineering team. As this is a consumer and not scientific device, there are cost limits on the nature of the particle sensor. Airthings does calibrate the particulate sensor to a scientific instrument. However, the Airthings sensor is most likely not able to distinguish between different particle size and scattering distributions that give the same overall signal. I had plans to do a cross correlation study with a scientific instrument, but circumstances conspired against me. At this time, I am satisfied that Airthings has done enough work that the threshold limits (green <10, yellow <25, and red >25 µg/m3) for the PM 2.5 sensor are reasonably close to the equivalent limits used by the US EPA and European PM 2.5 AQI. For the data that I’ve collected, there is very little difference between PM 2.5 and PM 1 signals. I have not investigated why. One caveat is that the data collected so far has an average PM 2.5 and PM 1 values of only 2 µg/m3 and only a single peak greater than 25. Since the rains have (finally) come, I don’t expect to have the opportunity to check against more polluted air conditions in the near term. Carbon dioxide: This provided the most surprise about the conditions in our home. I found that ventilation in our bedroom is insufficient to keep levels in the green without the window(s) being open at night. I am looking into ways to ameliorate this problem when keeping the windows open is not an option. When I first received the unit, I placed it outdoors to see if it would read the expected value of about 400+ ppm for average CO2. The unit read about 550, but it was before the 7-day calibration was completed. Over the course of the past month, when the room was well ventilated, I observed readings as low as 469 ppm. The unit will show the increase in CO2 when either 1 or 2 people are in the unventilated room for any significant period of time. VOC (volatile organic compounds): The measurement is in parts per billion, ppb. This is my first experience with VOC data recording. The unit is certainly responsive and exhibits significant signal when we are cooking, especially frying. As there are many different types of VOC, I cannot comment on whether one should take significant actions based on the results in the home. Do fry-cooks have career related health issues? At a work environment, such as an organic chemistry lab, there may be many types of VOCs that are clearly harmful to health. Radon: All the values that I have recorded are below the green threshold limit of 2.7 pCi/L (picocuries per liter). The average value over 2000 measurements is 0.7 and has a standard deviation of ±0.4. Temperature: Comparing the value to household sensors indicates that the temperature displayed by the Airthings sensor maybe between 1- or 2-degrees F high. However, I consider that within measurement error for accuracy given the nature of the other sensors. Precision appears to be excellent. Relative Humidity: Comparison only with household sensors. Appears to be within a few percent. Atmospheric Pressure: Excellent agreement (within 0.5 mBar) with external values (local weather data). Range of data recorded between 1001 mBar and 1022.5 mBar. User Interface (Unit): There is an E-Ink type display that is not illuminated. This is a very low power display and conserves battery. No power used to maintain the current display reading. It has high contrast and easy readability. You can choose 2 sensors to display via the app (Phone or PC). When you wave your hand in front of the unit, it indicates its assessment of the overall air quality (good, fair, or poor) and shows any of the readings that cause a fair or poor result. It then returns to the standard readout. I have not found the lack of illumination to be detrimental. User Interface (Phone): I’m using a Samsung Galaxy A51 with Android 11. The software allows you to choose among several devices that you might have. As I have only one, it displays a summary that is in the attached photo. You can then tap “VIEW IN WEB DASHBOARD” to get graphic displays for different periods of time. You can choose to get notifications via the app, if values exceed the Airthings recommended thresholds. You can choose the sensors for which to have notifications sent. These thresholds cannot be changed. I think it would be good to be able to change the thresholds with the understanding that one is responsible for the values used. User Interface (PC/Web): I’m using an Intel-based PC running Windows 10 Pro and MS Edge for this unit. See attached photo. The graphing is generally quite good. I’d prefer to be able to choose the order in which the different sensors are displayed. It might be possible to do this by deleting sensor graphs (called tiles) and then adding them back. I’ve not tried that. The vertical scaling is automated and determined by the range of values of the data being displayed. The scale cannot be changed, but you can zoom using touch, if your computer/phone has that capability. Adding the historical data (not shown in the photo) will expand the vertical size of each graph and give the minimum and maximum value for the data range. Bug: You can add a tile for the outdoor weather, but only for Oslo, Norway! They have given me instructions for changing the location, but the software for the View Plus is not the same as for the software shown in the instructions. I have made them aware of this. It is unclear to me whether they can and will offer software updates. Downloading Data: The .csv file contains the time and sensor data for the entire time the system has been recording for that location. If I don’t do something to re-start history, the data file will eventually grow to unmanageable size. They should allow you to specify the range or use the range chosen for the graphing display. The file name is also fixed as the serial number of the unit. These are serious limitations given the extra work caused for the user, I consider them bugs. The data are separated by semi-colons, so converting from text to columns in MS Excel is easy. The data are recorded with a UTC time stamp. Since I’m in California, it is easy enough to subtract 7 hours and put the local time in the next column. The headers have a few character-conversion bugs: “μ” instead of “µ.” The character “” is inserted in the Temperature column header. These are minor. The date/time format is 2021-09-30T20:04:28. The “T” separator is a nuisance and prevents Excel from recognizing the form of the data. If they would replace the “T” with a space, then Excel would have no trouble. I use the replace function to do this. Again, it is no big deal, but should be a simple fix. I have made Airthings aware of these bugs. I will append this review, if I find additional information that may be pertinent to other users. I hope this has been helpful. Appendix 1: I've added a comparison of the PM2.5 data from the Airthings View Plus (indoors near an open window) to Purple Air data from an outdoor sensor (not mine) about 100 meters from my home. The Purple Air data are shown in the US and European scales. The data are for the 24 hours of October 29, 2021. Correlation is excellent for the main peak.
B**M
I love this product. It was very easy to connect to wifi and to have the ability to track PM2.5,TVOC, radon, temperature and humidity all on one unit is very convenient. I bought a second unit to monitor the downstairs as well. As far as accuracy goes, it seems to track PM 2.5 closely to our outdoor conditions so I am happy. It is still too early to tell on radon but am doing a 3 month traditional test that will be completed later this spring so I will be able to compare. One benefit is that I can shut down air purifiers (saving filter life) when conditions dictate. Also, as CO2 or TVOC levels increase, I am able to start ventilating. Amazing to see the spikes in PM2.5 with cooking. Anyway, great device with excellent data stored for analysis. I love it.
V**R
Ich habe mittlerweile schon 4 Airthings View Plus Sensoren daheim und bin sehr zufrieden damit. Sie machen einen sehr solide verarbeiteten Eindruck und meiner Erfahrung nach erzeugen alle Sensoren sehr vergleichbare Messungen. Die Einrichtung war kinderleicht. Die Integration in ein Home Assistant Heimautomatisierungssystem funktioniert ebenfalls völlig problemlos. Besonders schön ist auch das e-paper basierende Display, welches man prima ablesen kann und zusätzlich sehr stromsparend arbeitet. In einem Fall hatte ich einen defekten Sensor. Keine Stunde später hat der sehr freundliche Support bereits geantwortet, ein paar Lösungsvorschläge gemacht und als klar war, dass es ein physischer Schaden war direkt die Zusendung eines Ersatzgerätes veranlasst. Ich bin sehr zufrieden und kann das System nur empfehlen.
K**N
i've used this for a few months. its very good and accurate enough for home use. kept in kitchen. display is good. batteries first installed 9 months ago and still going strong. app is also good and informative for current and historical readings. worth the cost.
M**A
We have two of these, gives great insight into indoor air quality, amazing how quick co2 levels raise in our well sealed home. Nice app which graphs the historical results. Would highly recommend.
K**C
El Airthings View Plus es un buen medidor de calidad del aire con varias funciones útiles. Se puede usar tanto con baterías como mediante USB-C. Cuando lo utilizas con USB-C, también puede funcionar como bridge para otros dispositivos Airthings, lo cual es un gran punto a favor. Lo que me gusta: - Alimentación flexible: batería o USB-C - Función bridge vía USB-C → muy útil si tienes varios dispositivos Airthings - App clara y fácil de usar - Actualizaciones rápidas: cada 2 minutos con USB-C, cada 10 minutos con batería - Soporte de API: funciona bien con Home Assistant, lo cual para mí es un gran plus - Pantalla e-ink: bajo consumo y aspecto limpio - Función “wave”: solo pasas la mano y te muestra un indicador de color sobre la calidad del aire Lo que me gusta menos: - Precio: se siente algo elevado - Precisión: suficiente para tendencias y uso general, pero no esperes precisión de laboratorio
ترست بايلوت
منذ أسبوعين
منذ 3 أيام